Rough Charts
2023
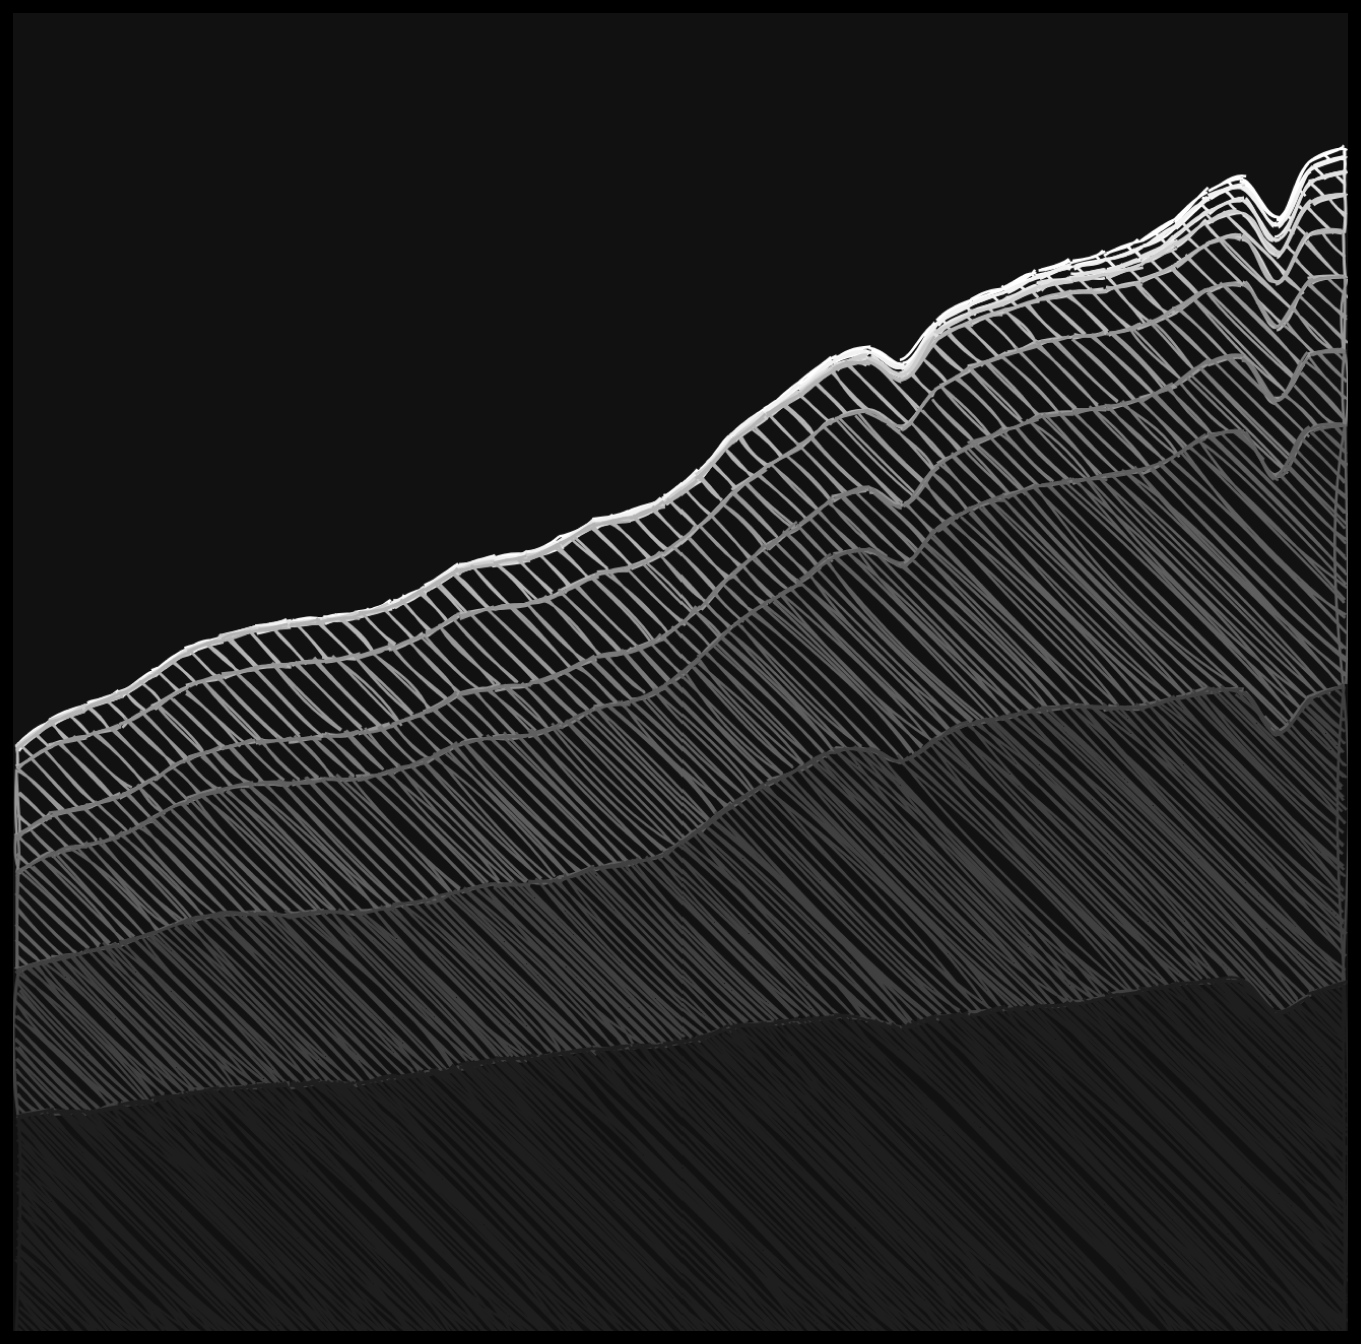
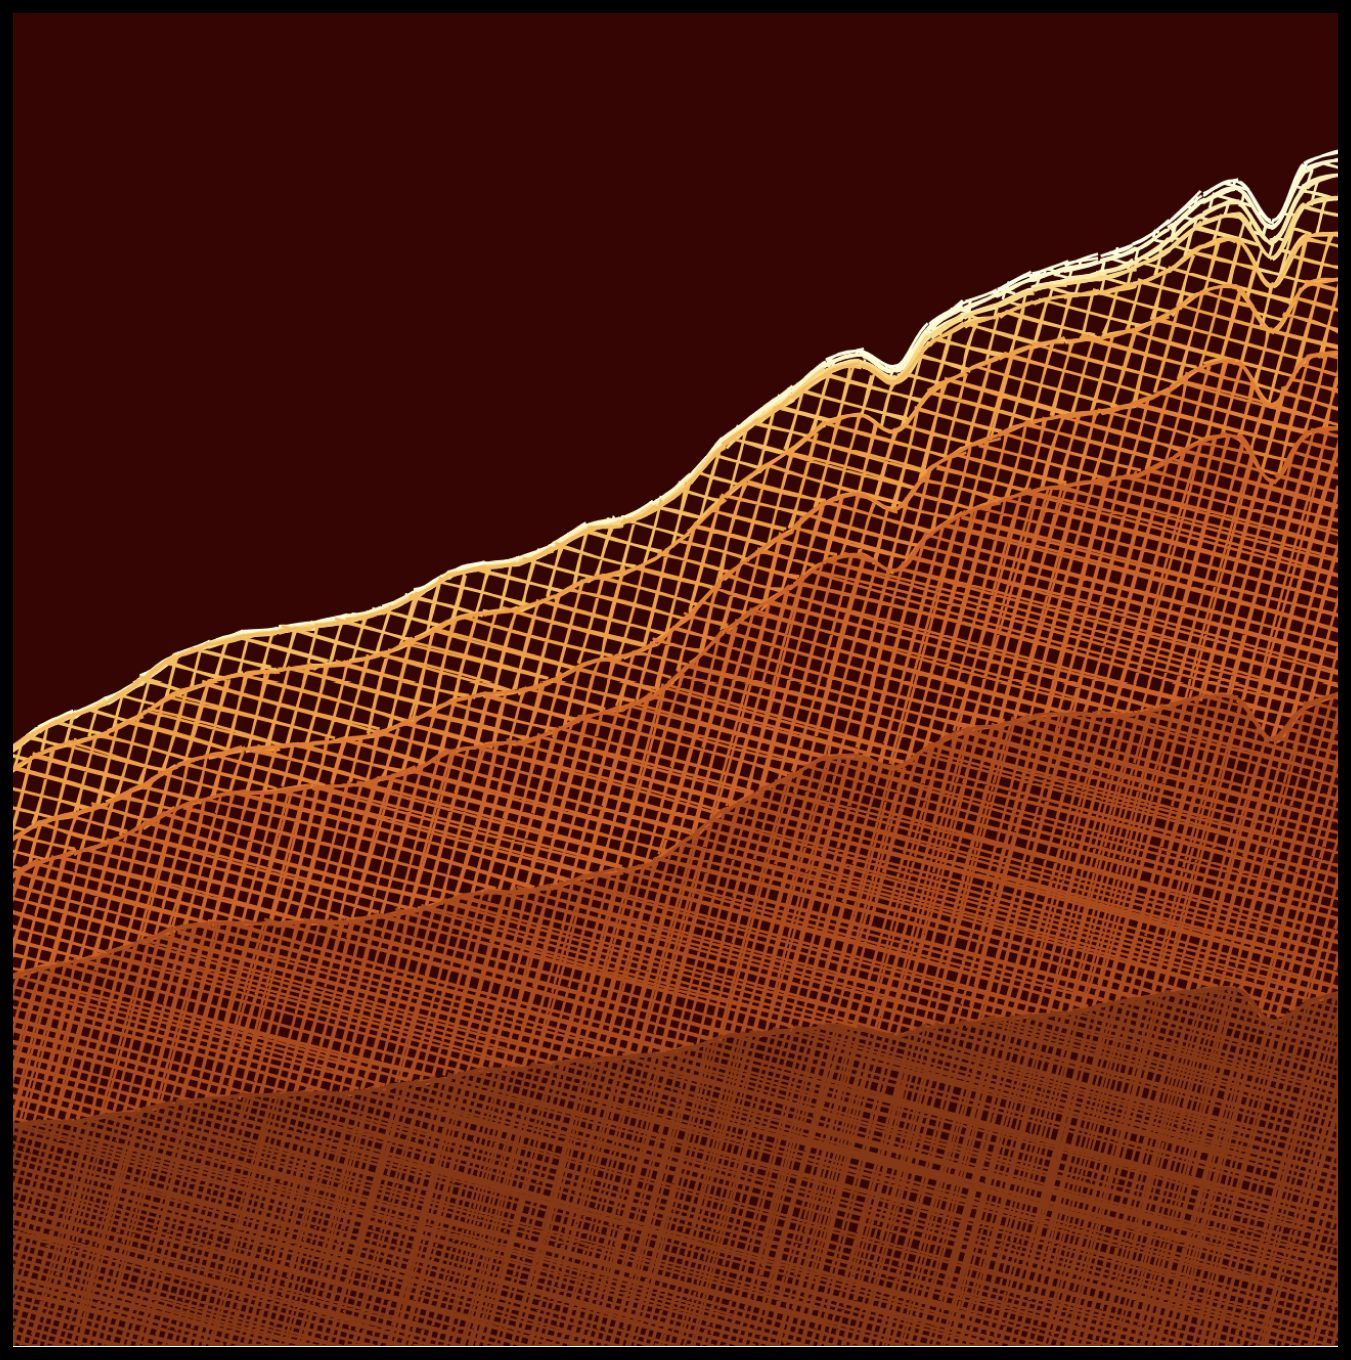
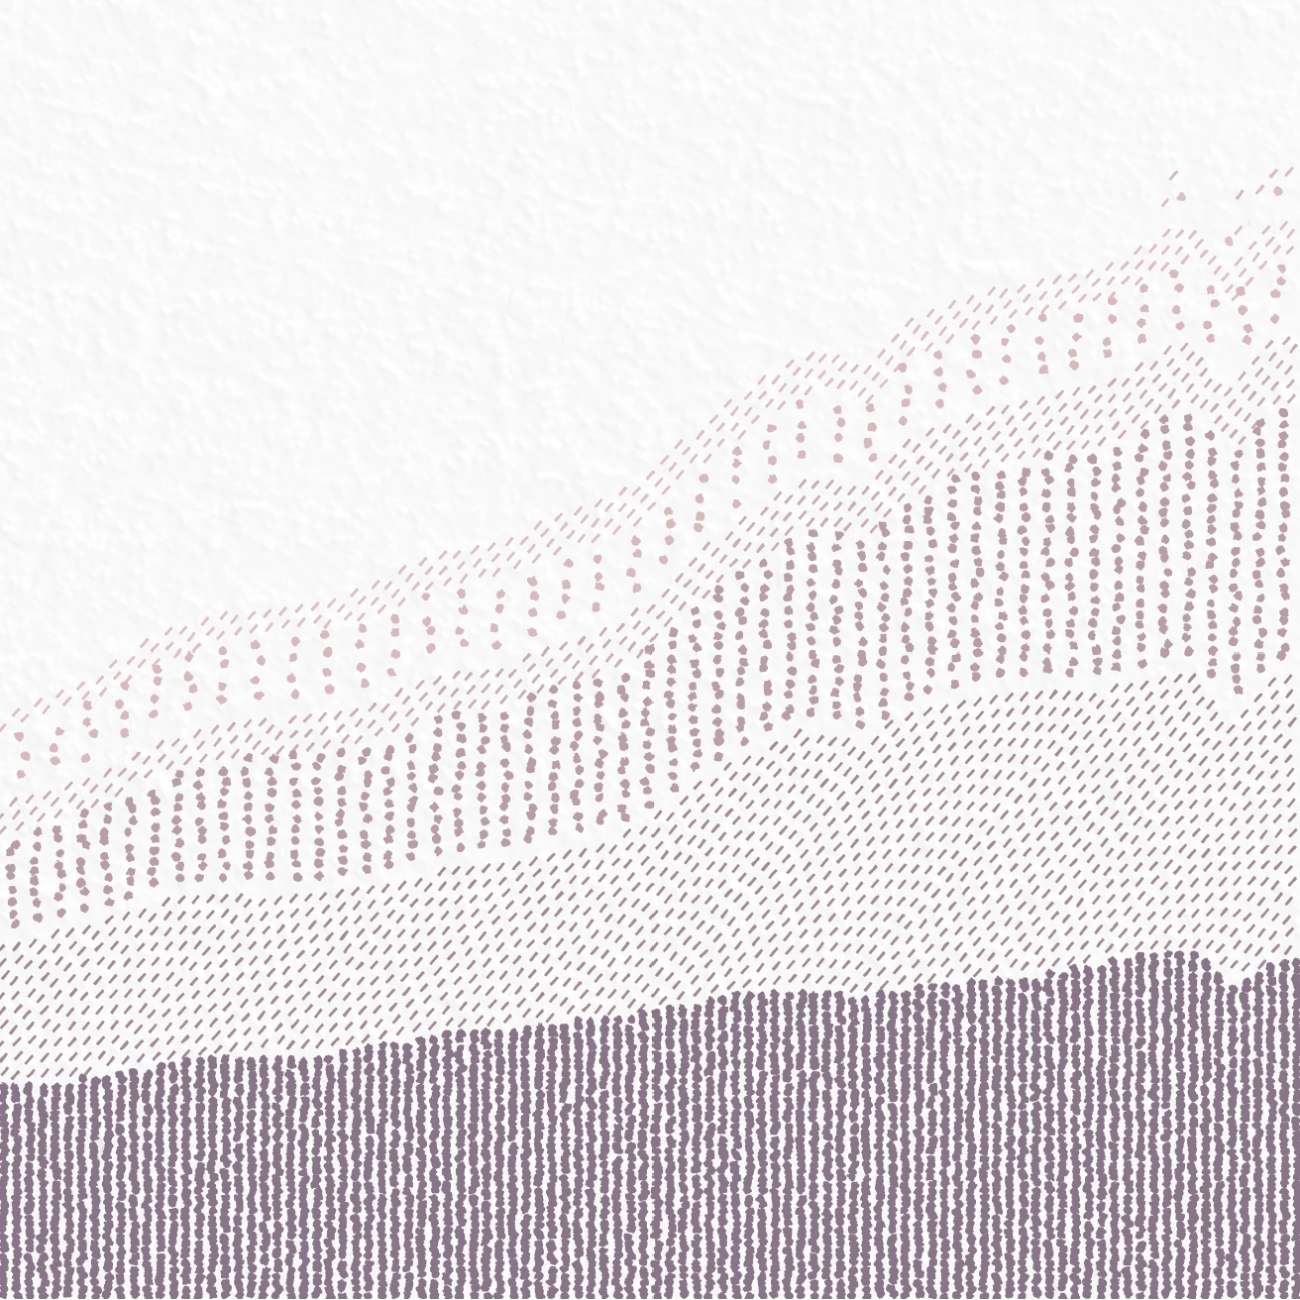
This series of experimental stacked area charts, created with Rough.js, explores innovative techniques for visualizing trends without relying on color. By using different patterns and hachuring techniques, I aimed to make the data more accessible and inclusive, ensuring that viewers can interpret the charts regardless of color vision differences.